Creating a Ham Radio Dashboard: A Journey into Signals and Simplicity
Building a Web Ham Radio Dashboard: Live Data at a Glance
TECH
3/29/20251 min read
Building a Ham Radio Dashboard
Introduction
Ham radio has always combined technical ingenuity with a spirit of exploration.
After returning to the hobby, I wanted a simple, clear way to monitor activity. The result was a lightweight online dashboard — designed to bring together live information in a single, readable view.
See it here: https://g0ikv.qsy.to
Project Overview
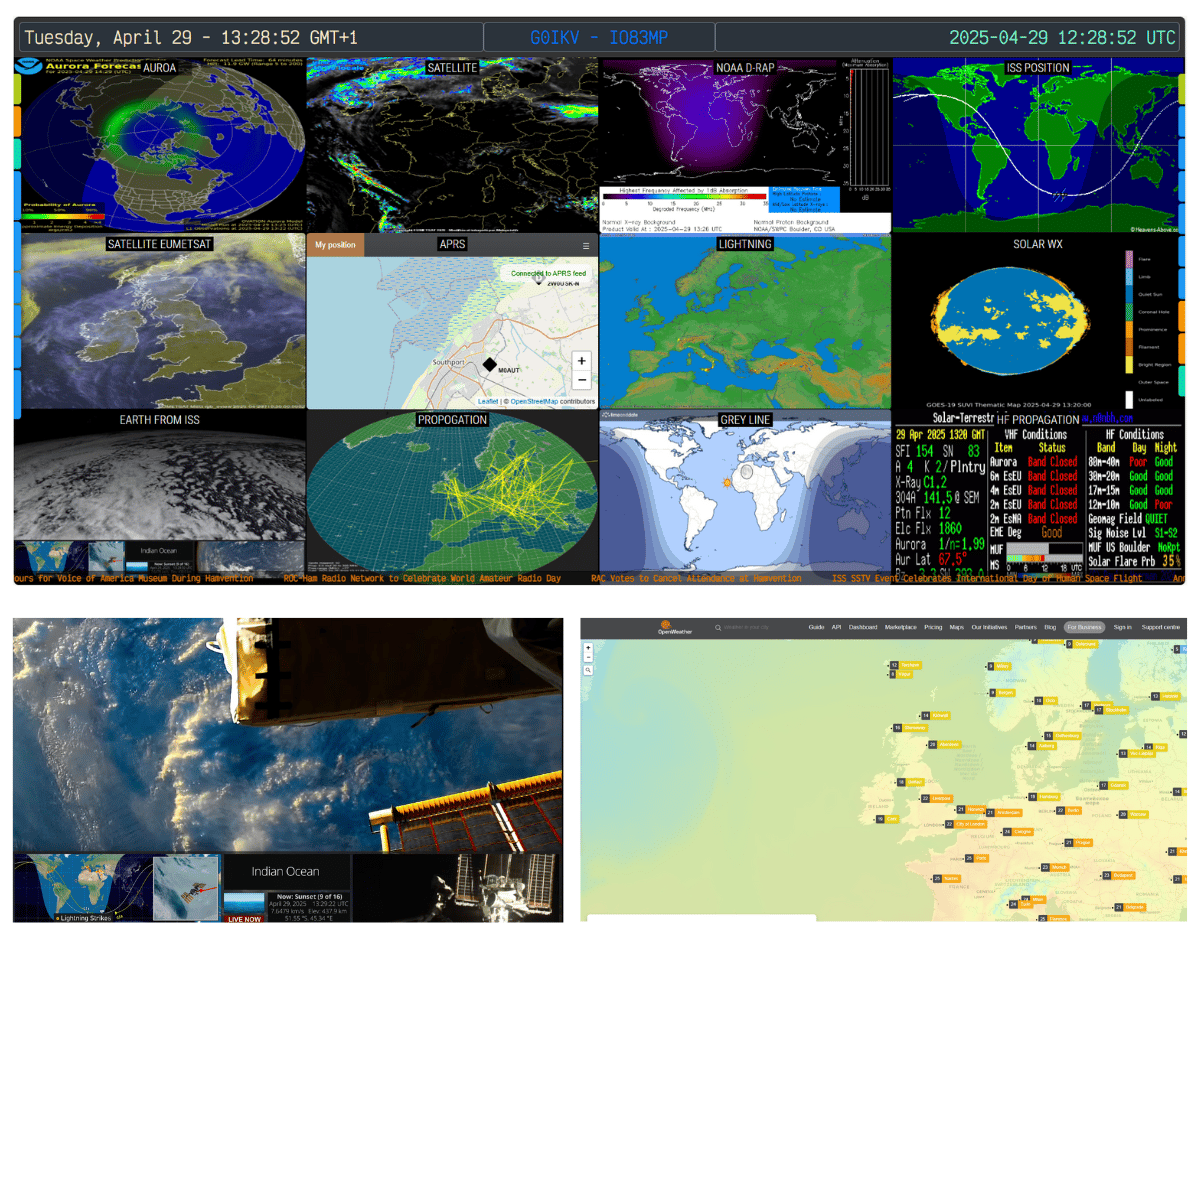
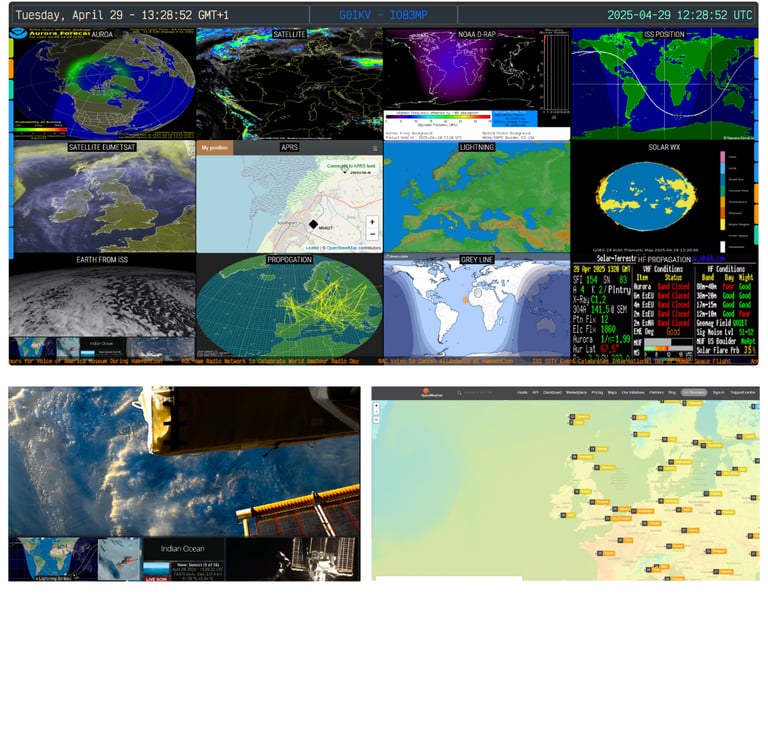
The dashboard provides real-time visibility of key operating data:
Stations heard (RX) and stations hearing me (TX)
Weather and RF Conditions
A live video feed from the International Space Station (ISS), which adds an extra dimension!
The aim was to create a quick reference tool — giving immediate feedback on operating conditions with an attractive display.
Initially, I considered building the system around a Raspberry Pi. However, while researching options, I discovered an excellent open-source project by VA3HDL. His HamDashboard provided a robust foundation. I adapted and adjusted it for use in the UK, modifying the settings to suit my own station (G0IKV) and local needs.
Technical Details
The dashboard is built from a series of embedded iframes, drawing live data from a range of public online sources.
This approach has several advantages:
Minimal server load — there’s no need to maintain direct API connections or databases
Simple hosting — the dashboard can run on lightweight webspace or even locally
Modularity — new sources or views can be added simply by embedding additional frames
Key elements include:
Because the dashboard relies on existing, reliable online services, it stays lightweight and avoids unnecessary technical overhead — ideal for a personal or small station setup.
Reflections
Building this dashboard has added a new dimension to my amateur radio activity.
Instead of relying solely on traditional logs, I now have a live, real-time window into band conditions, propagation patterns, and station performance.
The project also reflects a wider truth about amateur radio: that blending traditional skills with new tools keeps the hobby dynamic, flexible, and always evolving.
Anyone interested in learning more about the original project can visit VA3HDL’s GitHub repository here — an excellent starting point for building your own personalised dashboard.
Thanks to VA3HDL for the inspiration — radio is better when ideas are shared. 📡✨
Connect
Please Get in Touch
Services About Contact Privacy Policy / Cookies / Legal
Personal Projects: Photography | Poetry | Blog
© 2025. All rights reserved