Building a Live Train Display
A small, always-on departure board for my two nearest stations, Meols Cop and Southport. The look came first; the live feed is now running, showing real departures for Meols Cop.
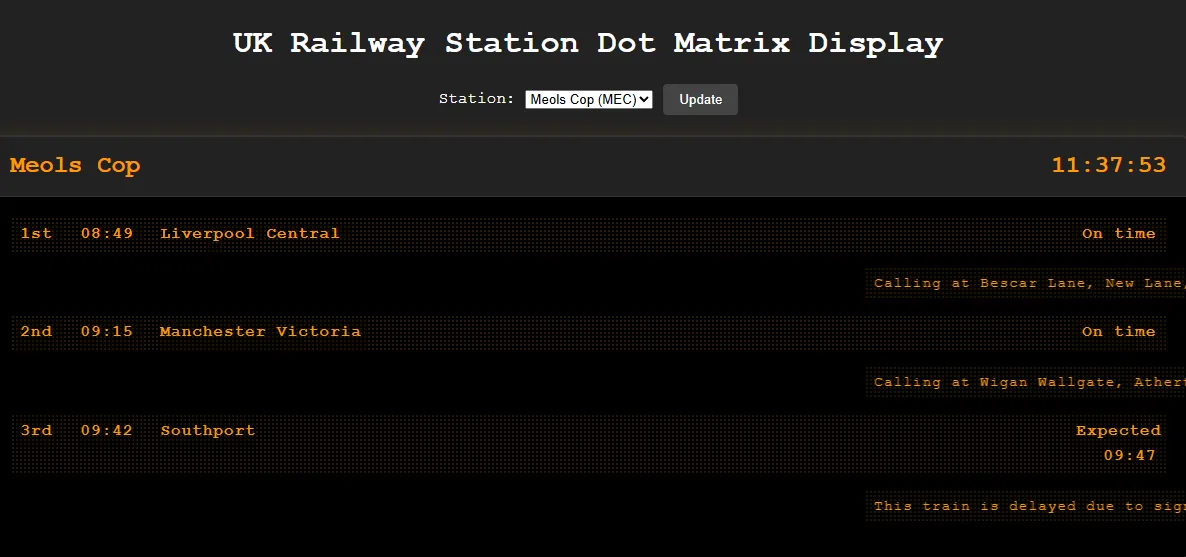
There is something quietly absorbing about a railway departure board. The promise of movement, the rhythm of arrivals and departures, the small certainty of a time set against a destination. I wanted a little of that at home, so I started building a live train display.
The idea was simple: a small, always-on dashboard showing real-time departures and arrivals for my two nearest stations, Meols Cop and Southport. As these things tend to, it grew into something more layered, a quiet conversation between technology, design and daily life.
The build
At its heart is a Node.js application. The original plan was to connect to the Darwin Push Port; in the end the live data comes from National Rail Enquiries, via the Rail Data Marketplace. The foundations, the server, the dashboard, the styling, were in place long before the feed was.
For a long while the board scrolled placeholder text and sample announcements, which was enough to judge the look, the flow and the readability. It felt alive. That was also the catch; a convincing display of sample data is exactly the sort of thing that can look finished while telling you nothing true, and the work that remained, the live feed, was the work that made it honest.
Not any more. This is the live board for Meols Cop, updating every thirty seconds:
The goals were modest and specific:
- Accuracy and speed: near real-time updates, without heavy page loads or awkward refreshes.
- Local relevance: only my two nearest stations, nothing else.
- Simplicity: clean, readable information, suited to a small wall-mounted display or a browser tab.
For the look I borrowed from Customer Information Systems, the low-resolution boards you see on platforms, at bus stops and across underground networks. These displays, also called Passenger Information Displays, exist to deliver clear, current information: arrival and departure forecasts, disruption notices, and details such as train formation, the number of coaches, step-free access, and where the first-class coaches sit.
Their bold simplicity is deliberate. A passenger making a fast decision in a busy concourse has to read the board at a glance. I wanted the same clarity, and the same restraint.
Reflections
There is a particular satisfaction in small projects like this. They are achievable, personal, and quietly meaningful. I did not set out to build a dashboard so much as a small window onto the rhythm of my own street.
It is another instance of calibrated ideas meeting ordinary life, where a piece of technology earns its place by adding to presence rather than demanding attention.
What’s next
With the live data flowing, a few directions suggest themselves:
- Southport: the second of the two stations the board was always meant to cover.
- Station status alerts: short summaries when there is real disruption.
- A radio link: perhaps feeding the board into Home Assistant alongside my amateur radio dashboard.
The sample trains have gone; the departures are real now, and I still stop to read them.